Monitoring & Alert Dashboard
Part of: Uptime Monitoring & Alerts
The problem
When a small business site or tool goes down, the owner usually finds out from an angry customer.
What I built
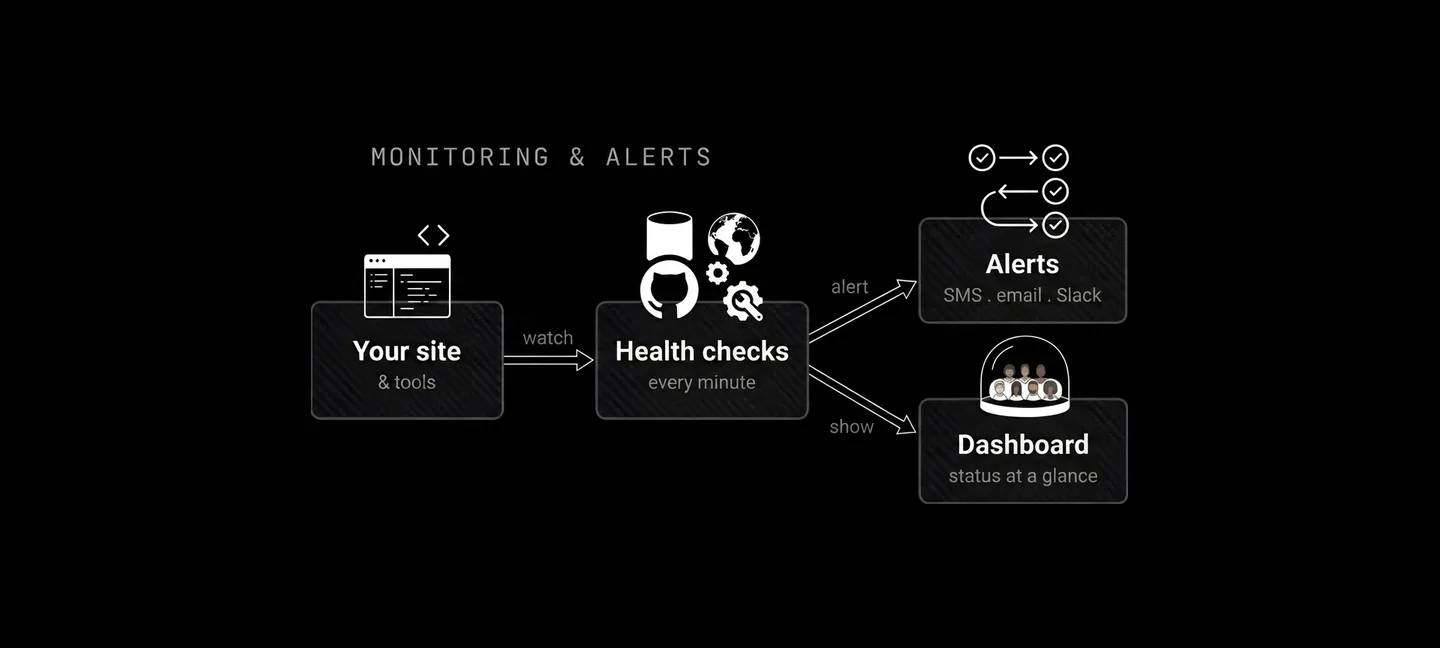
Uptime and health checks watch every service and fire instant alerts (text/email/Slack) on failure, with a simple status dashboard.
Stack
Outcome
Outages are caught in seconds and fixed before customers notice.
Want to see this in action, or set it up for your business?
Request a walkthrough